Overview
The SiteManager Platform 'Dashboard' provides a single pane of glass view of all SiteBackup and SiteDeploy activity on the site. The dashboard page is made up of configurable widgets and tiles that display information about particular activities, events, and system health.
Each user account in the SiteManager Platform has its own dashboard that can be customized to show information that is most relevant to that user.
Widgets and Tiles
Tiles
At the top of the dashboard is a set of warning tiles designed to indicate whether there are any items of concern in the SiteManager Platform:

The warning tiles are:
|
Warning Tile
|
Description
|
|---|---|
| Computers without backups | Number of computers that have not had a backup created within the time limit specified in 'Settings' > 'Notifications' > 'Backup Expiry Period (Days)' |
| Last backup failed | The number of computers where the last backup failed. |
| Repository errors | The number of repositories that are in an error state. |
| Unscheduled computers | The number of computers that are not part of a scheduled backup or have a locally scheduled backup in Macrium Reflect. |
| Disconnected computers | The number of computers that have been added to SiteBackups but which are not currently connected. |
| Unlicensed computers | The number of computers being managed by SiteBackup that don't have a valid license (either a standalone Reflect license or a SiteBackup Seat license). |
If a tile is in an error state, clicking the tile will navigate to the relevant section of the SiteManager Platform and display information to assist with further troubleshooting.
Widgets
In the large dashboard area, the currently enabled widgets are displayed:

The available widgets are:
|
Widget Name
|
Description
|
|---|---|
| Forecast | An overview of any upcoming backups - may be configured to show different repositories or time periods. |
| Activity | Progress bars and information for any current task, including image backups and restores, image deployment, and rescue/deployment media creation. Depending on the activity, the 'i' button can be clicked to display a more detailed progress view. |
| Computers | Overview of the status of computers currently being managed, and their connection status. |
| Image Status | A bar chart of backup results for a chosen time period. |
| Notifications | The events and notifications that have been generated by SiteManager Platform, with tools to filter and delete them. |
| Repository Disk Usage | The free and used space on a repository or golden image store, shown in pie chart format. |
Editing the Dashboard
The dashboard can be edited using the 'Edit Dashboard' button at the top right of the 'Dashboard' page.
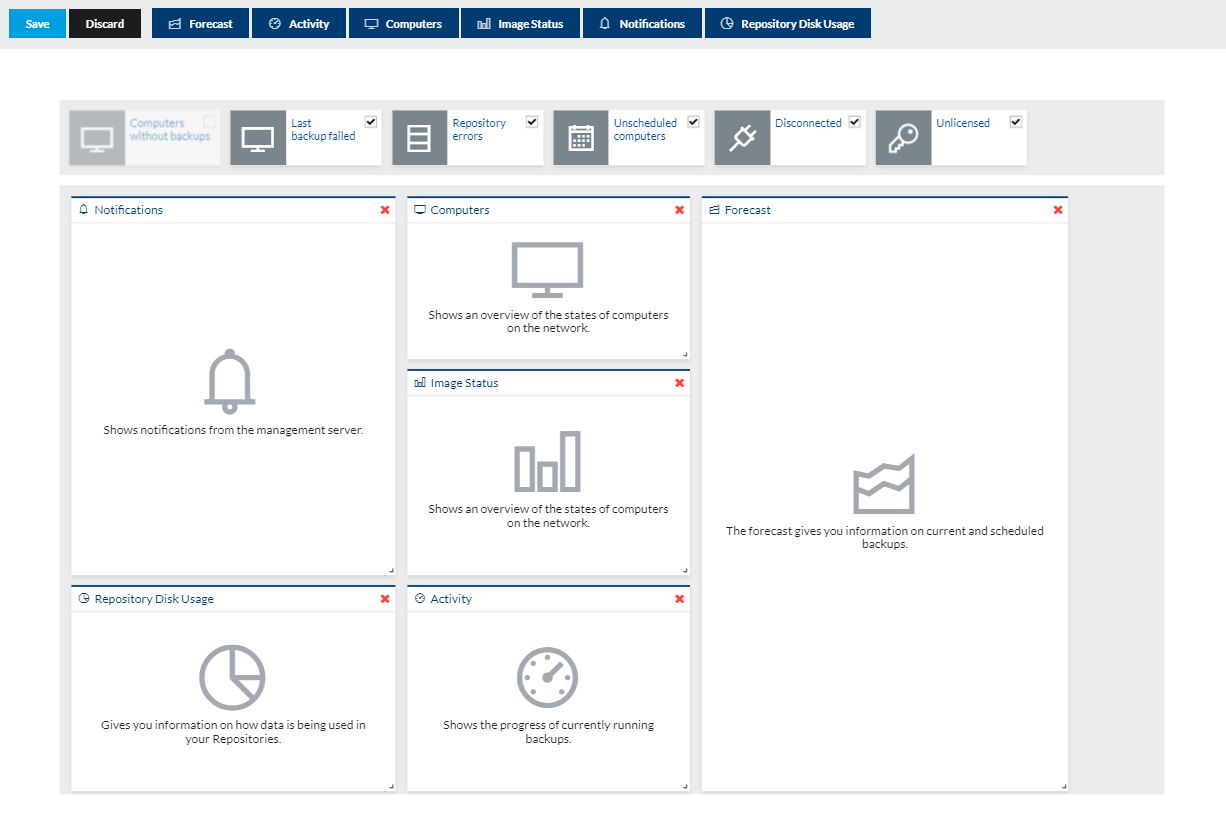
The top bar allows new widgets to be added to the dashboard - clicking a button will add a widget to the dashboard below the existing widgets. Multiple widgets of the same type may be added (e.g. adding two repository disk usage widgets to show disk usage on two different repositories). The configuration may also be saved or changes discarded here.
The widgets can then be reordered by dragging them to a new position, resized by dragging the handle on the bottom right of the widget, and deleted using the 'x' icon on the widget:

The warning tiles can also be toggled on and off using this page.
Resetting the Dashboard
The user can reset their own dashboard using the 'User Interface' page of the SiteManager Platform under the 'User Settings' heading:

The 'Dashboard' layout can be reset for all users on the 'User Interface' page of the SiteManager Platform settings, under the 'System Settings' heading by users with the relevant permissions:
